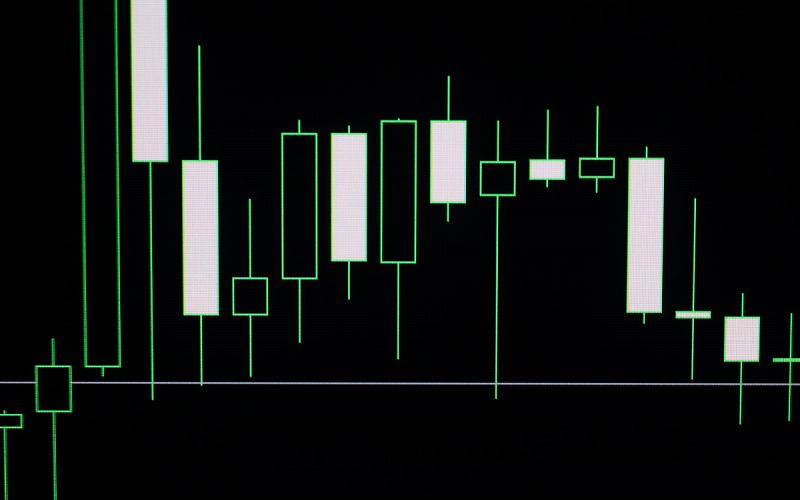
Intraday trading, the art of buying and selling financial instruments within the same trading day, offers immense opportunities for profit in the stock market. However, it also comes with its fair share of risks. One powerful tool that intraday traders use to navigate these markets effectively is chart patterns. These patterns are visual representations of price movements that can help traders identify potential entry and exit points, manage risk, and make informed trading decisions. In this comprehensive guide, we’ll explore how to effectively use intraday trading chart patterns to enhance your trading strategy.
Introduction to Intraday Trading Chart Patterns
Understanding Intraday Trading
Before delving into chart patterns, it’s essential to understand the concept of intraday trading. Unlike traditional investors who hold positions for days, weeks, or even months, intraday traders aim to capitalize on short-term price movements. They buy and sell securities within the same trading day, profiting from fluctuations in price.
Importance of Chart Patterns
Chart patterns are formations that appear on price charts, indicating potential future price movements. These patterns are formed by the interplay between supply and demand forces in the market. By analyzing these patterns, traders can gain insights into market sentiment and make informed trading decisions.
Common Intraday Trading Chart Patterns
There are various chart patterns that intraday traders commonly use to identify trading opportunities. Here are some of the most prevalent ones:
Head and Shoulders
The head and shoulders pattern is a reversal pattern that signals a potential trend change. It consists of three peaks: a higher peak (the head) flanked by two lower peaks (the shoulders). Traders look for this pattern to anticipate a reversal from an uptrend to a downtrend or vice versa.
Double Tops and Bottoms
Double tops and bottoms are reversal patterns characterized by two peaks or valleys at approximately the same price level. These patterns indicate a potential reversal in the current trend, offering traders an opportunity to enter or exit positions.
Triangles (Ascending, Descending, Symmetrical)
Triangles are continuation patterns that represent a period of consolidation before the price breaks out in the direction of the prevailing trend. Ascending triangles have a flat top and a rising bottom, while descending triangles have a flat bottom and a declining top. Symmetrical triangles have converging trendlines and suggest indecision in the market.
Flags and Pennants
Flags and pennants are short-term continuation patterns that occur after a strong price movement. Flags have parallel trendlines, while pennants have converging trendlines. These patterns indicate a brief pause in the market before the continuation of the previous trend.
Cup and Handle
The cup and handle pattern is a bullish continuation pattern that resembles a tea cup with a handle. It consists of a rounded bottom (the cup) followed by a smaller consolidation period (the handle) before the price resumes its upward movement.
How to Recognize Chart Patterns
Recognizing chart patterns requires a keen eye for detail and an understanding of key characteristics to look for. Some common characteristics include symmetry, trendlines, and volume confirmation. Traders can also use technical analysis tools such as moving averages and oscillators to confirm the validity of a pattern.
Using Chart Patterns for Entry and Exit Points
Once a chart pattern is identified, traders can use it to determine optimal entry and exit points for their trades. Entry strategies may involve buying when the price breaks above a resistance level or selling when it breaks below a support level. Exit strategies, on the other hand, may involve setting profit targets or using trailing stop-loss orders to protect gains.
Risk Management with Chart Patterns
Risk management is crucial in intraday trading to protect capital and minimize losses. When trading chart patterns, traders should set stop-loss orders to limit potential losses and employ proper position sizing techniques to manage risk effectively.
Backtesting Chart Patterns
Before incorporating chart patterns into their trading strategy, traders should backtest them to evaluate their effectiveness. Backtesting involves analyzing historical data to see how well a particular pattern has performed in the past. This helps traders gauge the reliability of the pattern and make informed decisions based on empirical evidence.
Combining Chart Patterns with Other Indicators
While chart patterns are powerful on their own, they can be even more potent when combined with other technical indicators. Moving averages, relative strength index (RSI), and volume analysis are just a few examples of indicators that traders can use to confirm the signals generated by chart patterns.
Psychological Aspects of Trading Chart Patterns
Trading chart patterns requires not only technical skills but also emotional discipline. Traders must learn to manage their emotions and stick to their trading plan, even when faced with uncertainty or adversity. Maintaining discipline and controlling emotions are essential for long-term success in intraday trading.
Case Studies and Examples
To illustrate the effectiveness of chart patterns in intraday trading, let’s examine some real-life examples of successful trades based on various chart patterns.
Tips for Success in Trading Chart Patterns
Continuous learning is key to success in intraday trading. Traders should stay updated on market trends, hone their technical analysis skills, and adapt to changing market conditions. Patience and persistence are also essential virtues for traders, as success in trading chart patterns often requires time and experience.
Common Mistakes to Avoid
Intraday traders should be aware of common pitfalls that can derail their trading journey. Overtrading, ignoring market context, and failing to stick to a trading plan are just a few mistakes that traders should avoid at all costs.
Adapting to Changing Market Conditions
Market conditions are constantly evolving, requiring traders to adapt their strategies accordingly. Whether it’s increased volatility or unexpected news events, traders must be flexible and adjust their trading approach to stay ahead of the curve.


